Friday, April 24, 2015

Tague Alliance 10th Annual Awards Event - Poker Face Masquerade

A huge thank you to those who attended our 10th Annual Awards Event! Here are a few fun photos from the night! Click the DropBox link below for more photos, and to find your guest photos as well!


Tuesday, April 21, 2015

Independent Insurance Agents Defying Doomsayers

Independent Insurance Agents Defying Doomsayers

By Andrew G. Simpson | March 12, 2015


According to analysts, technologists, aggregators and others, the independent agency system is in trouble.

Somebody forget to tell independent agents

Or more to the point, the doomsayers perhaps didn’t notice that independent agencies have been adapting and getting more into specialization. Or that they are employing technology along the lines suggested in order to succeed in the changing market. They may have dismissed the notion that not all trends are working against agents, including the finding that a majority of those who buy direct eventually return to their independent agent. Or the critics may be unaware how young agents are changing the business.

They may also have missed the latest agency profitability report.

The reality is that independent insurance agents and brokers continue to dominate property/casualty commercial lines and are also doing just fine in the competitive personal lines marketplace against direct response writers and captive carriers, the latest market report shows.
Market Share
Independent agencies (IAs) grew faster than the overall market and thus increased market share in about half of the states and the District of Columbia, according to the 2015 Market Share Study by the Independent Insurance Agents & Brokers of America (IIABA or the Big “I”). The study is based on 2013 data from A.M. Best.
IAs still control a majority of the entire P/C market, writing nearly 57 percent of all premiums; they write nearly 35 percent of all personal lines premiums; and they still dominate commercial insurance sales, writing nearly 80 percent of a market that has grown by more than $35 billion over the last three years, says the report.
The findings show that the independent insurance agency system continues to be “stable, strong and growing,” said Bob Rusbuldt, Big “I” president and CEO.
That may come as a surprise to some.
Warnings Aplenty
Agents are still upset about a 2013 report by McKinsey that they took to suggest that their demise was imminent.
A successful aggregator has suggested that the only way for smaller agencies to survive is to merge, although there is no doubt smaller agency mergers are an issue.
A leading technologist has warned that agencies will become extinct unless they follow its lead into online sales.
Others appear convinced that direct writers like GEICO have a huge advantage over agency carriers.
A respected CEO has suggested independent agents should be very scared about Google’s entry into the insurance business.
‘Good News’
Meanwhile, the latest market share numbers aren’t so scary for agents or their carrier partners.
Rusbuldt pointed to the “good news” in the study that all property/casualty insurance premium lines grew for the third year in a row, bouncing back from their recession‐driven low points in 2010. And after three years of growth, both personal and commercial lines have exceeded pre-recession volumes to where combined they are now generating $532 billion in annual premiums.
Combined, the market grew by $25 billion in 2013 over 2012 levels.
The Market Share Study revealed that at both the state and carrier level, independent agents and brokers were well poised to capture their share of the market or more. Furthermore, several IA carriers increased their market shares by substantial amounts. However, there was a significant divergence between the national and regional carriers in terms of growth, according to the Big “I.”
Other findings from the Market Share Study released by the Big “I” include:
  • IAs grew market share in 23 states and the District of Columbia. In many states, they dominate both personal and commercial lines. That suggests IAs in other states have an opportunity to add share in more lines if they put a renewed focus on it.
  • IAs can be as efficient as other models. In the personal auto market, both regional and independent insurance agency writers average better expense ratios than the captive agency model. What’s more, nearly a dozen IA companies rival or beat direct response writers on this key expense efficiency metric.
  • Personal auto premiums written by IAs grew nine times more in both 2013 and 2012 than they did in 2011. IAs increased premiums by $1.8 billion in both 2012 and in 2013—versus the mere $200 million growth figure reported in 2011.
All of which is not to say independent agencies face no challenges. A recent survey of agents by Accenture found that agents recognize that their strengths could be challenged by changing consumer behaviors, new technologies and the evolving competitive landscape. But their biggest concern is online competition from their own carriers.

Interested in becoming an Independent Agency? Contact Tague Alliance at 760-201-0923, or visit our website at www.TagueAlliance.com for more info on how to join.

www.insurancejournal.com

Wednesday, April 8, 2015

Uber and Lyft - One Insurance Agents Month Long Experiment

This is an interesting article about a month long experiment that was done by an insurance agency in Texas to figure out how much the drivers for Lyft and Uber knew about their insurance exposure.  At Tague Alliance we want our members to be informed and educated about emerging trends that affect our clients and industry.

Rent A CarJosh Waldrum knows from firsthand experience that most of the folks who drive for rideshare services like Uber and Lyft are not well informed about the insurance issues that insurance professionals see as problematic, such as coverage gaps and the amounts and types of coverage needed.
Waldrum is the director of search engine optimization (SEO) at Austin, Texas-based The Zebra, a digital auto insurance agency and online auto insurance comparison site. As a member of his company’s marketing team, he took the challenge of foregoing driving his car for the month of January in favor of getting around exclusively through the services of rideshare companies Uber and Lyft. He wrote about the experience in a blog on his company’s website.
Asked why he did this, Waldrum said: “We talked about it a lot. It somehow just naturally came up. I think I first mentioned, ‘What if we found somebody to give up their car for an entire year and document all the stuff?’ That was way too much. Then, ‘I think a month could make sense. I could do this. It’s not that hard.’
“It came from that. I blindly signed up for it. When it actually came January I was like, ‘Oh man, what was I thinking?’” But he said all was well in the end.
In all, Waldrum took 50 rides during the month: 25 with Uber in the first half of January and 25 with Lyft in the last half.
While his survey was in no way scientific, it was revealing. In conversations with drivers during his rideshare experiment, Waldrum found that a very large percentage of the drivers who work for these companies didn’t really know much about insurance requirements or about the coverage their respective companies provide. In addition, most didn’t tell their personal auto insurance companies that they were doing this.
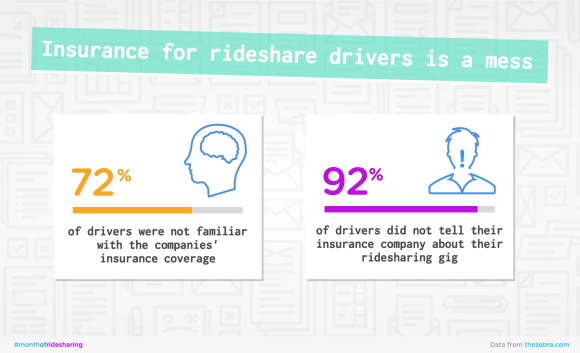
Specifically, he found that 72 percent of the drivers he spoke with were not familiar with the coverage offered by Uber and Lyft, and 92 percent of the drivers had not told their own insurance companies that they were driving for these companies.
“Definitely all the drivers were an open book when I asked about this,” Waldrum said.
rideshare_insurance-580x353
Waldrum said he believes companies like Uber and Lyft probably do communicate to their drivers about the insurance coverages the companies provide. But, he said, “I don’t think they do a good job of telling them the other piece of it, which is that their personal insurance company would want to know” that their insureds are driving other people around for a fee.
One of the main concerns of personal auto insurers has been the coverage gap between the time a driver is logged into the online rideshare service application as being available to pick up a customer and when a customer is actually in the vehicle.
Waldrum said the rideshare drivers he spoke with generally were confused about such coverage issues.
“I’d taken a lot of Uber before this whole experiment. Since I started working here I always found myself asking the drivers about insurance because I’m learning about it here and it was interesting,” Waldrum said.
“There was confusion all around the board. When I’d ask them, ‘How does Uber’s insurance work?’ or ‘How does Lyft’s insurance work?’ I got a lot of confused responses, where people really weren’t totally sure when they were covered and what was covered by Uber and Lyft,” he said.
Cheaper Rides
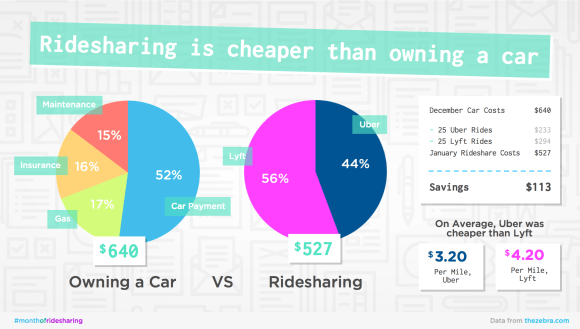
In his blog post, Waldrum said that factoring in the cost of car payments, gas, personal auto insurance and auto maintenance, ridesharing—at least for him for one month—was cheaper than driving his own car. Waldrum estimated his personal auto expenses for a month amounted to $640, while the cost of his 50 Uber/Lyft rides for the month of January came to $527.
He recognized that the results were subjective and that his commute to work was only 3.25 miles. A longer commute obviously would have translated into more expensive rides, as would a larger number of total rides taken.
He also acknowledged the limitations in exclusively using rideshare services versus driving one’s own vehicle. “After doing this experiment, I realized that having the flexibility to go anywhere at any point in my own car was something that’s hard to put a price tag on,” Waldrum wrote.
rideshare_costs-580x329
He said his experiences with both Uber and Lyft were “completely satisfying,” however. The average wait time for both was just over four minutes, and though he had expected he might have a harder time getting a ride in the morning when it was time to go to work, that did not occur.
Uber was somewhat cheaper than Lyft (Uber lowered its prices during the time of Waldrum’s experiment); the 25 rides with Lyft cost Waldrum $60 more than the 25 rides with Uber.
He found that more than half of the drivers he used (60 percent) drove for both Uber and Lyft and that there was a wide range in the age of the drivers—from college students to retirees.
The Insurance Challenge
Local communities, states and the insurance industry all are grappling with the issue of finding workable solutions that provide public protection while allowing for innovation and growth in new ventures like TNCs.
Legislation is pending in at least 35 states addressing the insurance challenges that TNCs present, according to the National Association of Insurance Commissioners (NAIC), which recently adopted a white paper on transportation insurance coverage issues in the sharing economy.
The NAIC’s paper, Transportation Network Company Insurance Principles for Legislators and Regulators, outlines insurance considerations to help state and local policymakers who are crafting TNC laws or regulations.
In the paper, the NAIC points out that “though the largest TNCs provide commercial coverage, those TNC’s policies may not provide the same uninsured/underinsured motorist (UM/UIM) coverage, medical payments coverage, comprehensive coverage or collision coverage that the drivers had purchased in their personal auto policies.”
The NAIC also acknowledged that many drivers are unaware that their personal auto policies have livery exclusions, under which coverage is disallowed for activities such as driving people around for a fee. Other TNC drivers may know about the exclusion but “simply hope for the best,” the NAIC said.
Some say the insurance industry has been slow to respond to the needs of the growing TNC industry with new products that address issues such as the coverage gap, but companies now are beginning to create new offerings for this industry.
In November 2014, Erie Insurance introduced rideshare coverage in Indiana and Illinois that provides coverage for every part of the trip—before, during and after the hired ride—by removing the “business use” exclusion in its policies, the company said.
In response to a new law in Colorado that requires rideshare drivers to have insurance for the “gap” period, in January Farmers Insurance created a rideshare coverage endorsement to meet that state’s mandate. Other companies like MetLife and USAA also have rolled out TNC products in Colorado.
In February, GEICO said it was launching a product that provides coverage both for personal and ridesharing use. The product is offered through GEICO Commercial at a price that is significantly lower than taxi and commercial rates, according to the company.

Tuesday, April 7, 2015

Understanding Commercial Property Underwriting and ‘COPE’

Understanding Commercial Property Underwriting and ‘COPE’

By Christopher J. Boggs | February 3, 2015


Construction, Occupancy, Protection and Exposure (COPE) are the same four basic elements of underwriting data that real property underwriters have used for nearly 300 years.

So what are these time-honored elements? The following paragraphs briefly explain each element of COPE.

Construction (C)

For underwriting analysis, construction is broken down into three sub-parts:
  • Construction materials;
  • Square footage; and
  • Age of the structure.
Construction Materials
Insurance Services Office (ISO) defines six construction classifications (from “1” to “6”) based on the combustibility and damageability of the materials used to construct the structures “major structural features.” The lower the number, the more susceptible the structure is to damage by fire. Construction class codes are a function of the “major structural features”: exterior load-bearing walls combined with roof and floor(s).
Assigning a construction class code is first a function of the load-bearing wall material and secondarily a function of the floor and roof materials. Four exterior, load-bearing wall types are considered along with four floor and roof types. Combining the wall type with one the floor/roof types produces the structure’s construction class.
Mixed Construction Problems
What effect does a combination of building materials and assemblies have on a commercial property’s construction classification? Factually, mixing construction material can be detrimental to the building’s ultimate construction class and loss cost/rate.
Simply, to qualify for a higher construction class rating, the superior construction must equal or exceed 66 2/3 percent of the ratable structural feature. This 2/3 requirement applies first to the walls and separately to the combined area of the floors and roofs.
Square Footage
Structure size influences many aspects of the underwriting process related to the “construction” element of “COPE.” Square footage also factors into the “protection” section of COPE (i.e. the need for a sprinkler system, etc.). But the main aspect of structure size from the underwriting aspect is in the comparison of the building’s “maximum possible loss” (MPL) versus its “probable maximum loss.” (PML)
Essentially, it is “possible” that the entire structure may be destroyed in any one loss; thus the MPL is the entire structure (100 percent). However, the chances that the building will suffer a total loss are inversely proportional to the size of the structure. Basically, the larger the building, the less likely the entire structure will be destroyed in a single event. Thus, the PML percentage decreases as building size increases (subject to the protection (“P”) used in the building).
Age of the Structure
Aging structures create concerns and questions in the underwriter’s mind. Specifically, underwriters concern themselves with the building’s major systems (roofing, plumbing, HVAC and wiring) when underwriting an older structure. The older the structure, the more likely a major system will malfunction, leading to a possible claim due mostly to an internal issue rather than caused by an external force.
Have the systems been maintained and updated as necessary? When were the last updates? What was the extent of those updates? Who did the updates? These are all questions underwriters may ask when evaluating older structures.
Agents should concern themselves with the age issue as well. Many construction-related ordinances and laws may have been updated or enacted since the building’s original construction. Any increased cost related to bringing a structure into compliance with local building codes following a covered cause of loss is specifically excluded in the un-endorsed commercial property policy.
Importance of ‘Construction’ Information
Taken on its own, “construction” may ultimately be the most important element in property underwriting. Although the second element, “occupancy” (what the insured does), is often seen as primarily important among the four elements; occupancy really is secondary to construction when the risk is a class of business the underwriter normally writes.
Granted, construction and occupancy can each be seen as a function of the other in regard to underwriting decisions, often times the decision comes back to construction. For example, an underwriter may offer coverage to a restaurant in a masonry/non-combustible building (construction class “4”); but may not be willing to offer coverage to the same operation located in a joisted/masonry building (construction class “2”).

Occupancy (O)

“Occupancy” information is comprised of two parts: 1) what the insured does; and 2) how the insured manages the hazards associated with what they do. Determining what the insured does is rather simple; determining how they manage their “hazards of occupancy” requires closer investigation (either by the agent, insurance carrier staff, or independent inspection firm).
Each class of insured (retail, office, wholesale, manufacturing, service, etc.) presents its own relative risk of first party property loss. The greater the risk of loss, the more closely the underwriter analyzes the operations (occupancy) and the higher the relational cost of coverage. An office, for example, presents less of an operational hazard than does a paint and body shop; resulting in a lower property occupancy rate factor for the office.
Beyond merely knowing the insured’s operations/occupancy, the insurer must also investigate how the insured manages those operations (part two of the occupancy review). Similar insureds do not necessarily manage operations in the same manner. Since each insured manages its exposures and hazards differently, each has its own “hazards of occupancy” that must be considered in the underwriting process.

Protection (P)

Underwriters and building code officials are often jointly interested in the property protection aspects of structures, but for different reasons. Property underwriters view property protection measures in regards to their ability to lessen the amount of property damage; building code officials generally view protection from a general public and personnel protection angle.
Sprinkler systems, fire extinguishers, alarm systems, fire doors and fire walls, and public fire protection are the primary protection mechanisms evaluated by underwriters. A particular structure’s construction and occupancy may dictate which property protection mechanisms are required or desired by the underwriter.

Exposures (E)

Is the insured property exposed to any external hazards? Not all hazards are related to the insured structure or operation; some come from outside the premises or are simply geographic in nature. A few external exposures relevant to property underwriters include:
  • The insured structure’s proximity to a high-hazard operation;
  • The local wildfire risk;
  • The possibility for damaging winds and/or water;
  • The structure’s flood zone location (located in or near a special flood hazard area (SFHA));
  • The structures earthquake exposure; and
  • The jurisdictions building code requirements.
Understanding COPE fosters better planning during the property underwriting process. Knowing what to provide and why to provide specific information makes the underwriting process smoother and, hopefully, quicker. Also, knowing COPE can assist clients when planning upgrades to current structures or constructing new buildings.

Questions about writing construction exposures? Contact your Agency Specialist. Or, if you'd like more information on joining Tague Alliance to obtain access to multiple markets, please contact our office at (760) 201-0923, or visit our website at www.TagueAlliance.com
- www.insurancejournal.com

Wednesday, February 11, 2015

Understanding Commercial Property Underwriting and ‘COPE’

Construction, Occupancy, Protection and Exposure (COPE) are the same four basic elements of underwriting data that real property underwriters have used for nearly 300 years.
So what are these time-honored elements? The following paragraphs briefly explain each element of COPE.

Construction (C)

For underwriting analysis, construction is broken down into three sub-parts:
  • Construction materials;
  • Square footage; and
  • Age of the structure.
Construction Materials
Insurance Services Office (ISO) defines six construction classifications (from “1” to “6”) based on the combustibility and damageability of the materials used to construct the structures “major structural features.” The lower the number, the more susceptible the structure is to damage by fire. Construction class codes are a function of the “major structural features”: exterior load-bearing walls combined with roof and floor(s).
Assigning a construction class code is first a function of the load-bearing wall material and secondarily a function of the floor and roof materials. Four exterior, load-bearing wall types are considered along with four floor and roof types. Combining the wall type with one the floor/roof types produces the structure’s construction class.
Mixed Construction Problems
What effect does a combination of building materials and assemblies have on a commercial property’s construction classification? Factually, mixing construction material can be detrimental to the building’s ultimate construction class and loss cost/rate.
Simply, to qualify for a higher construction class rating, the superior construction must equal or exceed 66 2/3 percent of the ratable structural feature. This 2/3 requirement applies first to the walls and separately to the combined area of the floors and roofs.
Square Footage
Structure size influences many aspects of the underwriting process related to the “construction” element of “COPE.” Square footage also factors into the “protection” section of COPE (i.e. the need for a sprinkler system, etc.). But the main aspect of structure size from the underwriting aspect is in the comparison of the building’s “maximum possible loss” (MPL) versus its “probable maximum loss.” (PML)
Essentially, it is “possible” that the entire structure may be destroyed in any one loss; thus the MPL is the entire structure (100 percent). However, the chances that the building will suffer a total loss are inversely proportional to the size of the structure. Basically, the larger the building, the less likely the entire structure will be destroyed in a single event. Thus, the PML percentage decreases as building size increases (subject to the protection (“P”) used in the building).
Age of the Structure
Aging structures create concerns and questions in the underwriter’s mind. Specifically, underwriters concern themselves with the building’s major systems (roofing, plumbing, HVAC and wiring) when underwriting an older structure. The older the structure, the more likely a major system will malfunction, leading to a possible claim due mostly to an internal issue rather than caused by an external force.
Have the systems been maintained and updated as necessary? When were the last updates? What was the extent of those updates? Who did the updates? These are all questions underwriters may ask when evaluating older structures.
Agents should concern themselves with the age issue as well. Many construction-related ordinances and laws may have been updated or enacted since the building’s original construction. Any increased cost related to bringing a structure into compliance with local building codes following a covered cause of loss is specifically excluded in the un-endorsed commercial property policy.
Importance of ‘Construction’ Information
Taken on its own, “construction” may ultimately be the most important element in property underwriting. Although the second element, “occupancy” (what the insured does), is often seen as primarily important among the four elements; occupancy really is secondary to construction when the risk is a class of business the underwriter normally writes.
Granted, construction and occupancy can each be seen as a function of the other in regard to underwriting decisions, often times the decision comes back to construction. For example, an underwriter may offer coverage to a restaurant in a masonry/non-combustible building (construction class “4”); but may not be willing to offer coverage to the same operation located in a joisted/masonry building (construction class “2”).

Occupancy (O)

“Occupancy” information is comprised of two parts: 1) what the insured does; and 2) how the insured manages the hazards associated with what they do. Determining what the insured does is rather simple; determining how they manage their “hazards of occupancy” requires closer investigation (either by the agent, insurance carrier staff, or independent inspection firm).
Each class of insured (retail, office, wholesale, manufacturing, service, etc.) presents its own relative risk of first party property loss. The greater the risk of loss, the more closely the underwriter analyzes the operations (occupancy) and the higher the relational cost of coverage. An office, for example, presents less of an operational hazard than does a paint and body shop; resulting in a lower property occupancy rate factor for the office.
Beyond merely knowing the insured’s operations/occupancy, the insurer must also investigate how the insured manages those operations (part two of the occupancy review). Similar insureds do not necessarily manage operations in the same manner. Since each insured manages its exposures and hazards differently, each has its own “hazards of occupancy” that must be considered in the underwriting process.

Protection (P)

Underwriters and building code officials are often jointly interested in the property protection aspects of structures, but for different reasons. Property underwriters view property protection measures in regards to their ability to lessen the amount of property damage; building code officials generally view protection from a general public and personnel protection angle.
Sprinkler systems, fire extinguishers, alarm systems, fire doors and fire walls, and public fire protection are the primary protection mechanisms evaluated by underwriters. A particular structure’s construction and occupancy may dictate which property protection mechanisms are required or desired by the underwriter.

Exposures (E)

Is the insured property exposed to any external hazards? Not all hazards are related to the insured structure or operation; some come from outside the premises or are simply geographic in nature. A few external exposures relevant to property underwriters include:
  • The insured structure’s proximity to a high-hazard operation;
  • The local wildfire risk;
  • The possibility for damaging winds and/or water;
  • The structure’s flood zone location (located in or near a special flood hazard area (SFHA));
  • The structures earthquake exposure; and
  • The jurisdictions building code requirements.
Understanding COPE fosters better planning during the property underwriting process. Knowing what to provide and why to provide specific information makes the underwriting process smoother and, hopefully, quicker. Also, knowing COPE can assist clients when planning upgrades to current structures or constructing new buildings.

Questions regarding Commercial Property Underwriting and "COPE" can be directed to our Commercial Lines Agency Specialists by calling (760) 201-0923, or visiting our website at www.TagueAlliance.com
By Christopher J. Boggs | February 3, 2015
www.InsuranceJournal.com

Wednesday, December 3, 2014

Most Employees Do Not Trust The Boss

At Tague Alliance we value our team highly and put a lot of work into building open, honest, and trustworthy relationships with our employees.  The article below was a bit shocking, but not surprising.  Many employees do not trust their boss or manager which is totally sad.  We encourage you to make sure you are being open, honest, consistent, proactive, and accountable with your agency staff to facilitate a healthy and productive team.

More than half of the people surveyed give their organizations low marks for trust and effective leadership, according to a consulting firm specializing in workplace performance improvement.
Interaction Associates, which has released its annual workplace trust research,Building Workplace Trust 2014/15also finds links between “trust leader organizations” and revenue growth, and between “trust leaders” and high levels of innovation.
As part of the survey, workers were asked to rate the statement: “Employees have a high level of trust in management and the organization.”
In response, only four out of ten agreed that the description was suitable for their organization well. Fifty-eight percent found their organizations lacking. In addition, 26 percent of those surveyed say they trust their boss less this year than in 2013.
For the purposes of the Building Workplace Trust research, trust is defined as the willingness to accept personal risk based on another person’s actions. And on the measure of risk and safety specifically, people trust their peers more than the boss.
More than half of those surveyed—54 percent— say they feel safe communicating their ideas and opinions with colleagues and peers. In contrast, only 38 percent of those surveyed say that people feel safe communicating their ideas and opinions with leadership.
Asked about the appropriateness of another statement—“My organization has effective leadership”—only 45 percent agreed.
This year’s research—the sixth annual report—polled more than 500 people employed at companies worldwide in a range of job functions and industries. Interaction Associates commissioned the international research company, IDG Research Services, to implement this year’s Building Workplace Trust survey.
In a statement about the survey, Linda Stewart, CEO of Interaction Associates, said: “Our research consistently points to how trust is critical for driving business results—and yet we see such a high rate of mistrust among the working population this year.
“The results are alarming especially in light of the importance people place on trusting their leadership—some 82 percent of all respondents say that trusting their boss is essential for them to be effective in their job,” added Stewart.
Difference Of OpinionTrust Leaders, Laggards and Financial Performance
Other findings in Building Workplace Trust specifically detail the differences between trust leader organizations and trust laggards, defining “trust leaders” as the 10 percent of companies whose workers agree that “Employees have high trust in leaders and the organization” describes their organization “extremely well.”
According to Interaction Associates, companies that are trust leaders are more than two-and-a-half times more likely than trust laggards to also be leaders in revenue growth.
What’s more, trust leaders significantly outperform all other organizations in achieving key business goals, such as customer loyalty and retention, competitive market position, ethical behavior and actions, predictable business and financial results, and profit growth, Interaction Associates says.
Building Workplace Trust also points to significant gaps between trust leaders and other organizations in the behavior and actions that foster the right cultural conditions for high trust in organizations.
Ninety-six percent of those surveyed who work for trust leader organizations say their leaders make decisions that are consistent, predictable, and transparent. Only 29 percent of non-trust leaders say that’s the case at their organizations.
Other behaviors and actions that foster trust—and where there are huge double-digit gaps between trust leader organizations and non-leaders—include:
  • People and teams can take risks (i.e. people are “allowed to fail” and learn from their mistakes).
  • People have a shared sense of commitment and responsibility.
  • The organization encourages transparency and shared understanding of key processes for decisions and initiatives.
Trust Drives Innovation
The consulting firm also finds that trust drives innovation, with gaps between leaders and laggards reported. According to the research, while 65 percent say that trust leaders prioritize innovation, only 14 percent say this is a priority for laggards.
Additionally, roughly 80 percent of employees report that a high level of trust inside an organization fosters both innovation and investment in new projects.
The bottom line of all the findings is that employees crave transparency from leaders, and they want input into decisions that affect them. The top five actions employees urge leaders to take in order to build trust are:
  1. Ask for input into decisions that affect me
  2. Give me background information so I can understand decisions
  3. Set me up for success with learning and resources
  4. Admit your mistakes
  5. Don’t punish people for raising issues (Don’t shoot the messenger!)
About the Survey
Interaction Associates commissioned the international research company, IDG Research Services, to implement the research for Building Workplace Trust 2014/15,polling more than 500 people employed at companies worldwide in a range of job functions and industries.
About Interaction Associates
Interaction Associates helps organizations around the world build high-involvement, collaborative cultures by developing their leaders, teams, and change agents. Services include customized consulting, learning and development, including live online programs, and coaching services. IA was named was named one of Training Industry’s Top 20 Leadership Training Companies from 2012-2014.
Source: Interaction Associates 

Friday, October 31, 2014

Tague Alliance - Litigation Trends In The Insurance Industry and Text Messages


At Tague Alliance we do our best to keep our members informed of current trends in our industry and the possible impacts to their agencies.  The litigation being brought against companies for violating the Telephone Consumer Protection Act (TCPA) is gaining momentum.  As insurance companies and agents start to embrace more text communications with prospects and clients it is of high importance that you remain compliant with the regulations.  There are stiff penalties for violating the TCPA.  The FCC outlines the expectations.

Source:  FCC http://www.fcc.gov/guides/spam-unwanted-text-messages-and-email

Spam: Unwanted Text Messages and Email
Background
Many consumers find unwanted texts and email – which can include commercial messages known as spam – annoying and time-consuming. And unwanted texts to mobile phones and other mobile devices can be intrusive and costly. Two laws – the Telephone Consumer Protection Act (TCPA) and the Controlling the Assault of Non-Solicited Pornography and Marketing (CAN-SPAM) Act – address spam.
Unwanted Texts and the Telephone Consumer Protection Act
The TCPA and the FCC’s rules ban many text messages sent to a mobile phone using an autodialer. These texts are banned unless (1) you previously gave consent to receive the message or (2) the message is sent for emergency purposes. This ban applies even if you have not placed your mobile phone number on the national Do-Not-Call list of numbers telemarketers must not call.
For more information on the TCPA and the national Do-Not-Call list, see our consumer guide.
Unwanted Texts and Email under the CAN-SPAM Act
The CAN-SPAM Act supplements the consumer protections provided by the TCPA. The CAN-SPAM law bans unwanted email messages sent to your mobile phone if they are “commercial messages.” (Email messages can sometimes appear as texts on your mobile phone, depending on how they’re addressed.)
The CAN-SPAM Act defines commercial messages as those that primarily advertise or promote a commercial product or service. The FCC’s ban does not cover “transactional or relationship” messages -- that is, notices to facilitate a transaction you have already agreed to -- for example, messages that provide information about your existing account or warranty information about a product you’ve purchased. The FCC’s ban also does not cover non-commercial messages, such as messages about candidates for public office, or email messages that you have forwarded from your computer to your wireless device (but read below about the FTC’s rules that may restrict such messages).
Federal rules require the following for commercial email sent to your mobile phone:
  • Identification – The email must be clearly identified as a solicitation or advertisement for products or services;
  • Opt-Out – The email must provide easily-accessible, legitimate, and free ways for you to reject future messages from that sender;
  • Return Address – The email must contain legitimate return email addresses, as well as the sender’s postal address.
Giving Your Consent
Under the FCC’s rules, texts and commercial email messages may be sent to your mobile phone if you previously agreed to receive them. For texts that are commercial, your consent must be in writing (for example, in an email or letter); for non-commercial, informational texts (such as such as those by or on behalf of tax-exempt non-profit organizations, those for political purposes, and other noncommercial purposes, such as school closings) your consent may be oral.
For commercial email, your consent may be oral or written. Senders must tell you the name of the entity that will be sending the messages and, if different, the name of the entity advertising products or services. All commercial email messages sent to you after you’ve given your authorization must allow you to revoke your authorization, or “opt out” of receiving future messages. You must be allowed to opt out the same way you “opted in,” including by dialing a short code. Senders have 10 days to honor requests to opt out.
What You Can Do to Stop Unwanted Texts to Your Mobile Phone and Spam in General
You can reduce the number of unwanted texts you receive by taking these precautions and actions:
  • Do not display your mobile phone number or email address in public.
  • Be careful about giving out your mobile phone number, email address, or any other personal information. Make sure to read through and understand the entire transmitting form. Some websites allow you to opt out of receiving email from partners – but you may have to uncheck a preselected box if you want to do so. Make sure to check for a privacy policy when submitting your wireless phone number or email address to any website. Find out if the policy allows the company to sell your information.
  • Do not respond to unwanted texts or emails from questionable sources. Several mobile service providers will allow you to forward unwanted spam texts by simply texting it to 7726 (or “SPAM”) to enable the providers to prevent future unwanted texts from the specific sender.
  • Check with your mobile service provider about options to block future text messages from specific senders.
  • Use an email filter. Some service providers offer a tool that filters out potential spam or channels spam into a bulk email folder. You may also want to consider filtering capabilities when choosing an Internet service provider.
  • You may want to use two email addresses – one for personal messages and one for newsgroups and chat rooms. Also, consider using a disposable email address service that creates a separate email address that forwards messages to your permanent account. If one of the disposable addresses starts to receive spam, you can turn it off without affecting your permanent address.
  • Try using a longer and unique email address. Your choice of email addresses may affect the amount of spam that you receive. A common name like “mjones” may get more spam than a more unique name like “da110x110”.
You can file a complaint with the FCC if you receive:
  • An unwanted commercial email message sent to your mobile phone;
  • An autodialed or prerecorded telephone voice message or text message to your mobile phone if you didn’t consent to the message previously (or it doesn’t involve an emergency). The FCC can determine whether the message was sent using an autodialer and thus violates its rules;
  • Any autodialed text message on your wireless device, or an unwanted commercial message to a non-wireless device from a telecommunications company or advertising a telecommunications company’s products or services, if the message is sent without your prior consent.
There is no charge for filing a complaint. You can file your complaint using an online complaint form. You can also file your complaint with the FCC’s Consumer Center by calling 1-888-CALL-FCC (1-888-225-5322) voice or 1-888-TELL-FCC (1-888-835-5322) for TTY; or writing to:
Federal Communications Commission
Consumer and Governmental Affairs Bureau
Consumer Inquiries and Complaints Division
445 12th Street, SW
Washington, DC 20554
What to Include In Your Complaint
The best way to provide all the information the FCC needs to process your complaint is to complete fully the online complaint form. When you open the online complaint form, you will be asked a series of questions that will take you to the specific section of the form you need to complete. If you do not use the online complaint form, your complaint, at a minimum, should indicate:
  • your name, address, email address and phone number where you can be reached;
  • the phone number or email address of the wireless device to which the message was sent, and, if a phone number, whether it is on the national Do-Not-Call list;
  • date and time of the unwanted message;
  • whether the unwanted message advertises or promotes a commercial product or service;
  • any information to help identify the sender or the individual or company whose products or services are being advertised or promoted, and whether any of this information was provided in the message;
  • whether the unwanted message provided any contact information to allow you to opt out of receiving future messages;
  • whether you gave the sender permission to send you messages; and
  • a description of any actions you took NOT to receive messages from the sender or individual or company whose products or services are being advertised, and when you took them.
What You Can Do About Commercial Email You Receive on Non-Wireless Devices, Such as Your Computer at Home
The Federal Trade Commission (FTC) has adopted detailed rules that restrict sending unwanted commercial email messages to computers. To find out more about the FTC’s rules, visit www.ftc.gov/bcp/edu/microsites/spam/rules.htm. To file a complaint with the FTC or to get free information on spam issues in general, visit www.ftc.gov/spam/ or call 1-877-382-4357 voice; 1-866-653-4261 TTY.
State Anti-Spam Laws
The CAN-SPAM Act is intended to preempt – or replace – state anti-spam laws, but states are allowed to enforce the parts of the CAN-SPAM Act that restrict non-wireless SPAM. Also state laws prohibiting fraudulent or deceptive acts and computer crimes remain in effect.
For More Information
For information about this and other communications issues, visit the FCC’s Consumer and website.